

Active Data Management Plans IG
Group Organizers
- Organized by
-
-
ADMP scenarios
-
Discussion
-
White paper with machine-actionable DMP use cases (April 2017)
ADMP
Proposal
Implementation
Handover
Preserve/ Re-use
Data
Rough ideas
Increasingly detailed
Complete
Continue
Metadata
Rough ideas
Increasingly detailed
Complete
Continue
Rights
Fairly firm
Very detailed
Complete
Continue
Distribution
Fairly firm
Increasingly detailed
Complete
Continue
Archive
Initial ideas
Initial ideas
Decided
Continue
(Adding) value
Initial ideas
More detailed
Much more detailed
Review process
The table above was an initial proposal for the phases and development of the active data management plan.
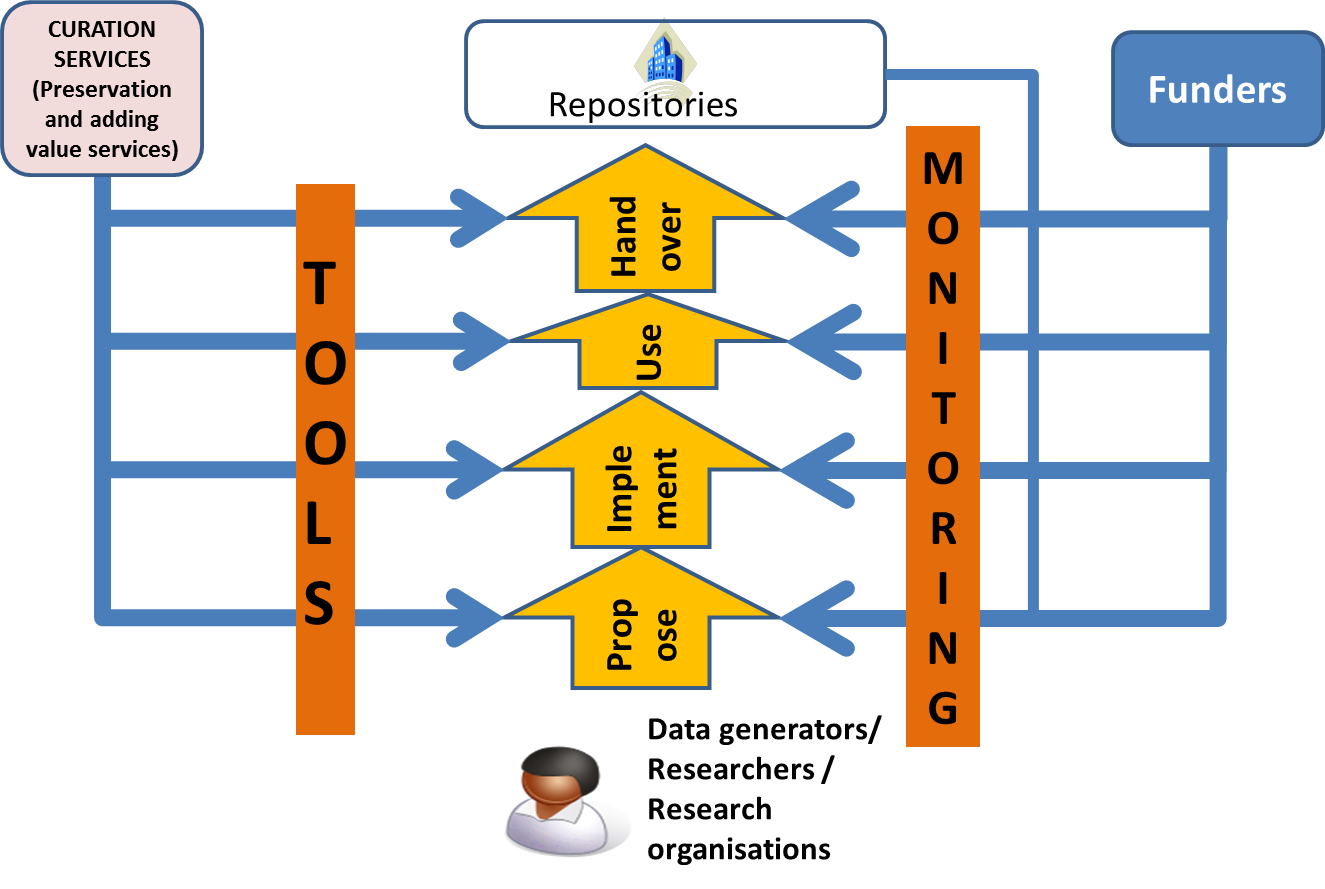
The diagram above indicates that tools are needed to help the data creators develop and evolve the ADMP while at the same time help the funders, and related stakeholders such as the repositories, check that the plans are adequate.
The text below provides more details based on some experience with a number of types of data creation/collection including :
- large national facilities
- astronomical satellites
- small group projects in cultural heritage, performing arts and various scientific disciplines
- individual research
- new data created by analysis of existing data
- cross-platform software systems
PLEASE ADD INFORMATION BASED ON YOUR EXPERIENCE
Details of the tools and services should follow once we have enough details in the text below.
Monitoring
An important part of the ADMP is that it can be monitored – so that any deficiencies in the ADMP can be detected and corrected by the data creators – who are probably the only people who know the required information.
The checking can be done in a number of ways:
Checklists
These can be done in an automated way – does some required thing, e.g. a document, exist. The quality of such a document would be difficult to judge automatically but some basic checks such as format or components of a complex object can probably be checked.
To judge the quality of the components of the ADMP is likely to require human judgment, and we might imagine that while some judgments require a significant amount of effort from domain expert, nevertheless there may be some aspects which may be judged quickly by a non-expert.
Expert evaluators
Disciplinary experts can perform more detailed checks. However the APARSEN study[1] suggests that this will not be a normal occurrence.
Non expert evaluators
A human could reasonably be expected to make some quality judgments by inspecting an image or a graph if there are some simple things that can be checked e.g. time stamps should increase monotonically, physical measurements are normally smoothly varying with respect to position or time. The data creator would need to provide the appropriate information.
- Simple display using data specific software
The software may be specific to the data
- Simple display using generic software
Perhaps more useful for multidisciplinary use to ensure that the data is described in a way which allows access by generic software. What is shown in the diagram is the use of some types of Representation Information to describe the data. Examples include EAST (ISO 15889:2011) and DRB, which can describe a wide variety of data; the data can then be parsed and used for other purposes. DRB could be likened as an annotated schema for a data set which can be used by something like XSLT to transform the data to something else. The diagram terms this “virtualisation”.
- Discovery
The discoverability of the data is important – although this may only be possible after the data is published – for example when handed over to the repository. The check on discoverability may be broken down into:
- Check Identifier
Given an identifier the check is simply that something is there
- Check searchability: the data creator should ensure that the data is findable.
Minimum check: the data creator provides the information about the search engine and search terms, and these should find the data
Multidisciplinary check:
Proposal
The proposal stage is the initial phase. At this point most of the details of the data have not yet been decided. There are various aspects which will be readily available:
CRIS information
The basic information about the project
Planned rates/volumes
Data rate and total volume are both important in determining problems to be addressed by the immediate data management plans. They are often linked by the length of time involved. The length of time for data collection may be well defined by the funding or else may depend on the success of the initial data collection.
Alternatively the volume of data may be very well defined, for example a survey requiring a specific number of samples.
Levels of data
The data collected or created is often termed raw or Level 0. This data may need to be processed to remove instrument signatures – perhaps requiring calibration data – producing what is often referred to as Level 1 data. Further processing may be needed, producing Level 2, Level 3 etc, before the data is usable for its primary purpose – and indeed may be essential before others can re-use the data. In many instances the all levels of data may be of interest, depending on the expertise of the next user.
At the planning stage it is likely that some details will be known about each of these levels although the processing steps and calibration data may be not be available.
- Standards
The standards, whether general international, disciplinary, project specific, can be defined. For example the project specific ones may be determined by an international collaboration, perhaps with special semantic conventions
- Formats
The basic formats will probably be reasonably well defined
Creation
In this phase the data is collected/created. Experience suggests that in some cases the original plans will be followed perfectly; in other cases there will be many details to be specified, including details of formats, semantics, error flags, modes of operation, ideas of potential interactions with other data, software, evolving standards, all possibly through several iterations.
Rates
Rates of collection – or at least the maximum rate of collection must be determined
Volumes
The volume of data should be well understood
Levels
As described under Planning, there may be data processed through several levels, all of which may be important. In the creation phase the details of the software, processes and additional information such as calibration data.
- Production process between levels
Experience suggests that processing between levels may be fixed from the start or it evolve over time as the data is better understood. In the latter case there will be a number of versions. These versions may be important, with different versions associated with different datasets. Alternatively all the data may be re-processed either as the final stage of the project or else on demand.
The processing may be thought of as Representation Information of the level being produced. In particular it may described as Other Representation Information.
As described in OAIS, Representation Information is really a network – a Representation Information Network (RIN). For example, as discussed below, a simple example would be a single piece of code which requires a number of software libraries. The Representation Information for that source code would consist of the documentation, compiler, software libraries, operating system. Each software library has Representation Information such as source code, design, interfaces, etc.
- Process description
The processing at each level may be simple or may be complex. In the latter case it consist of a number of smaller steps with decision points between each step or be performed in a monolithic piece of software. Besides software there may be other input, for example calibration data or human input.
The different components, software or data, may change independently.
- Processing software
Software can involve a mixture of languages, for example C, C++, C#, Java, Fortran, with some open source and others not, one language calling libraries written in another. The software will run on one or more operating systems.
- Provenance
The provenance tells us when and where the data was processed, and how. In some cases it is important to be able to validate the research by re-performing the data capture/creation. For observational data it may not be possible to re-capture the information. However it may be important to be able to re-run the processing.
Additional information is required and can be encoded in a variety of ways, for example OPM. Each of these encodings needs its own Representation Information.
- Who did it
Some kind of unique identification of the person or groups of people who created the data – or each level of the data.
- When
The time of data collection, processing events etc
- Representation Information
A description of some types of Representation Information . Other useful types are Semantics and Structure. Detailed discussions are available in OAIS. Together the Representation Information Network allows a member of the Designated Community to understand and use the data of interest.
One particular type of Structural Representation Information which allows the data to be used more easily across systems is a type of Structural and Semantic Representation Information which supports “virtualization”.
For example the DRB description allows one to look, where appropriate, at data, or part of the data, as a table or an image.
Primary use
The data is normally collected for some initial analysis. This involves a number of other aspects which may be important for the data creator(s) and therefore important for the initial portion of the lifecycle of the data and the management of the data.
- Analysis software
This can be described in a similar was to the processing software discussed above.
- Underlying concepts
The concepts which are needed to understand the data and its analysis are difficult to capture explicitly but references to papers, terminology etc. can help. These are important for the definition of the Designated Community.
- Related data sets
To analyse the data may require other datasets. These datasets will have their own Representation Information and Provenance.
Handover (to a Repository)
The data will be put in some (perhaps many) repository(ies). They should be involved in decisions about managing, preserving and re-using the data.
- Select repository if not already chosen
- List of recommended archives e.g. certified repositories
- Negotiate handover
- Will need to
- agree on consolidated list of information to hand over
- determine restrictions on access rights e.g. who can access, when, what must be private etc
- get input on Designated Community (although final definition is determined by archive)
- get ideas on possible re-use and any information e.g. special software etc that may be useful
- Need to agree on handover mechanism so that the archive has all the information needed to create AIPs etc – data, Representation Information, PDI, Descriptive Information etc
- For small amount of data this may be straighforeward e.g. one ZIP file
- For large amounts of data may need carefully planned handover in stages
- Will need to
Preservation
Preservation is judged on the continued usability of the data. The discussion above covers most of the aspects needed, as described next.
Definition of the Designated Community
Preservation Techniques
Add Representation Information
Migration
Hand over to another repository
Preservation strategies, Costs and Risk Management
Discovery and selection
Maintaining Archival Information Package
PDI
- Fixity of primary data objects
This should be calculated in a good data management system for the data
- Access rights
Noted above
- Reference information
For example a Persistent Identifier
- Context
The CRIS information
- Provenance
Noted above
Description Information
Related to the way in which the data is published and is finable.
Representation Info
Discussed in some detail above. Some additional information would be:
- People who one would like to understand the data
As input to the Repository’s definition of the Designated Community
Re-use and Adding value
An important aim of a data management plan is to help to ensure that the data can be re-used as easily as possible. Since no-one can foresee the future, it is not possible for the data management plan to be specific. Nevertheless it would be useful to have at least some ideas from the people who know the data best. These ideas from the data creator(s) will also help with ideas about how best to publish the data. These ideas could include:
- Access restrictions
- Potential related uses
- Potential related data sets
- Compatible analysis software
This is related to the virtualization, if any, that is available.
- Reproducibility
An increasingly important issue is the reproducibility of the research. The information noted earlier will help ensure the reproducibility of the research to the greatest possible extent.
Adding Value and Sustainability
The Blue Ribbon Task Force report “Sustainable Economics for a Digital Planet: Ensuring Long Term Access to Digital Information” (http://brtf.sdsc.edu/biblio/BRTF_Final_Report.pdf) talks about the importance of Value and says “In cases where future value is uncertain, choosing to preserve assets at low levels of curation can postpone ultimate decisions about long-term retention and quality of curation until such time as value and use become apparent.”
An important question is how value can be discovered and/or enhanced.
[1] http://www.alliancepermanentaccess.org/wp-content/uploads/downloads/2014/06/APARSEN-REP-D33_1A-01-1_1_incURN.pdf
Log in to reply.